Overview
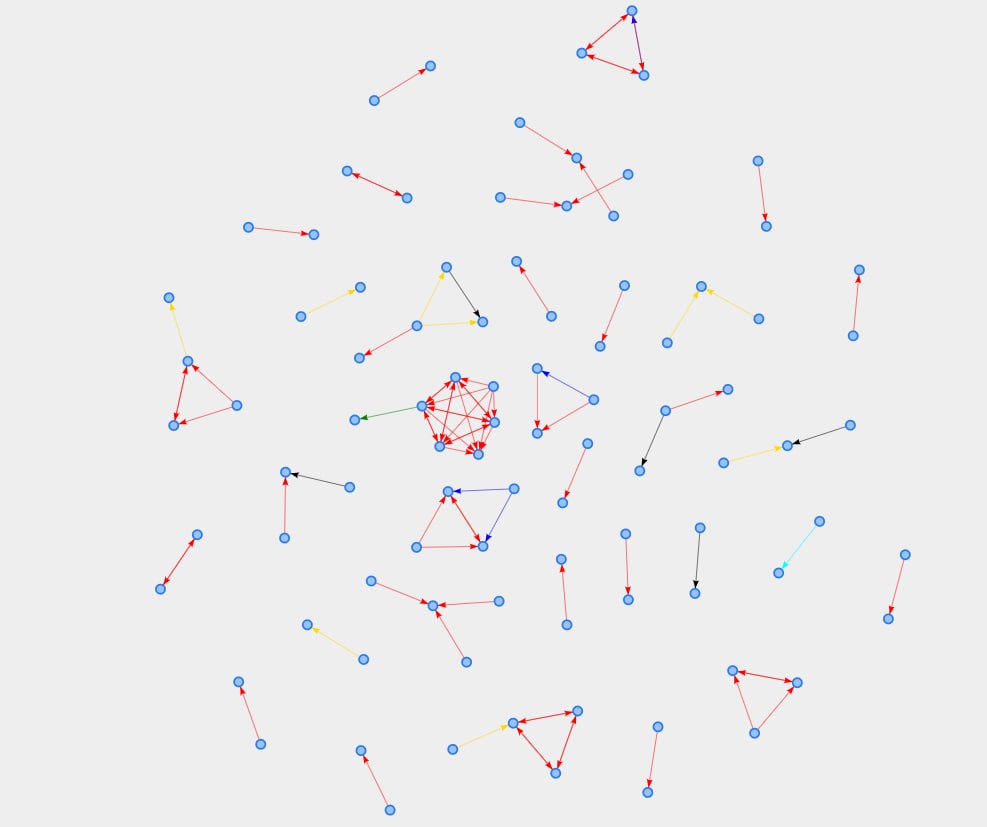
We study the spreading process of COVID19 by analysing contact tracing data through network and topological methods like graph calibration and standard persistent homology. We create an efficient pipeline and develop a Streamlit web application for data visualization. Interactions between users are modeled through simplicial complexes, allowing for higher dimensional information within the spreading process. Note : the GitHub repository contains notebooks with confidential clinical data and is thus private. Don't hesitate to contact me for more details.
Approach
We implement this using standard network and topology libraries, including GUDHI and NetworkX for the analysis. We use PyVis and Plotly for visualisation. Moreover, Streamlit is used in order to develop a web app (interactive dashPortfolio). The whole project is built as a Docker image. Data comes from a collaboration between the lab and hospitals in Geneva and are confidential - we thus chose to keep the GitHub repository private.